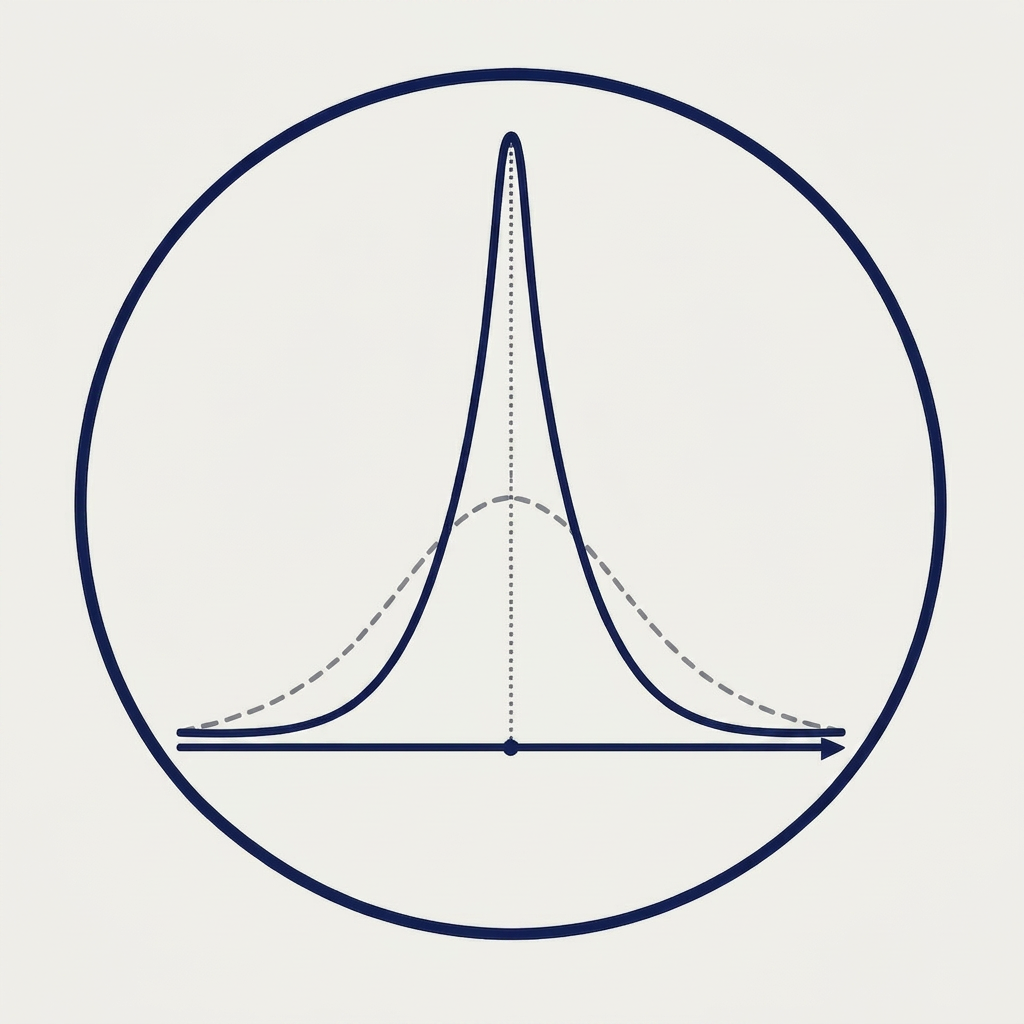
Strong negative skewness reduced the CPI by 2.2 percentage points (annualized) in July relative to the Median CPI increase (3.1 percent.) The August CPI report is scheduled for Friday, Sept. 11.
The CPI advanced 0.9 percent (annualized) in July, but the other CPI-based inflation measures were all above target for the month. Since April, the median CPI has been above target, while the other measures were at, or below target levels.
PCE inflation rose a near target at 1.9 percent (annualized) in July. Other PCE-based inflation measures were more elevated. Since April, all PCE-based inflation measures are above target. The next PCE price report is scheduled for Sept. 30.
Posts
For Post suggestions, please email an administrator listed at the bottom of the page.
-
Addressing Two Types of Bias in Inflation Estimation: A Lesson from Governor Waller’s Three-Good Economy
In 2021, Federal Reserve Governor Waller gave a speech at Stanford University called ‘The Economic Outlook and a Cautionary Tale on “Idiosyncratic” Price Changes and Inflation.’ In the talk he laid out a hypothetical example that was critical of the trimmed-mean approach to inflation measurement. Although the talk was quite some time ago, I’m motivated to write about it for a couple of reasons. First, Governor Waller will likely be an influential voice in discussions about the usefulness of various inflation metrics, including trimmed-mean and median inflation estimators. Second, I’ve heard this criticism–indeed, this exact example–repeated more recently on social media, so it has some popular appeal.
But it’s wrong.
Here’s his example:
Consider a three-good economy with goods A, B and C, and look at how their prices increase over time.…[C]onsider a world in which there are sharp price changes that are staggered across the goods. In year 1, the price of good A goes up 5 percent, while the price of goods B and C increase 2 percent. If we assume equal weights for each good, the inflation rate for this economy is 3 percent. This repeats in year 2, with the price of good B increasing 5 percent while the other two have increases of 2 percent. In year 3, good C sees the largest increase. In this economy, inflation averages 3 percent each year, which is above the FOMC’s 2 percent inflation target. Now, one could look at this data and manipulate it in several common ways. First, if one used a trimmed-mean measure of inflation, you would throw out the highest and the lowest readings for each year. What do you get? The average inflation rate would be 2 percent every year. Thus, over a three-year period, a trimmed mean measure of inflation would be 2 percent and indicate we are hitting our inflation target when the true measure would be 3 percent per year.”
What Governor Wallace has stumbled upon isn’t a problem with trimmed-mean estimators; it’s a problem of inappropriately using a symmetric trim when the underlying data distribution is clearly asymmetric. Let me explain.
I’ve created the underlying distribution that Governor Waller has concocted in the following chart:

In the example, the distribution stays the same from period to period. What changes is that the particular good rising 5% rotates between the three goods. Pictured is Good A rising 5%, but in the next period it would be Good B, and then Good C in the period after that. Governor Waller points out, correctly, that if you use a median approach to the data, the inflation rate would always read 2%, when obviously the true inflation rate is 3%. In other words, if the central banker pays attention to the median inflation rate, they would be misled into thinking inflation was at target (2%), when in fact it is running a percentage point too high.
What’s the problem with Governor Waller’s example? In the example, the underlying distribution is positively skewed, permanently. In situations like this, the trimmed-mean estimator has to take the persistent skewness of the distribution into account and asymmetrically trim. Otherwise, the trimmed-mean will be biased (persistently too low.) This is the reason the Dallas Fed uses an asymmetric trimmed-mean for the PCE price data, which are also persistently skewed. (Peter Rupert made this point in a recent U.S. Macro Snapshot post, but I think it’s worth repeating here.)
What is the asymmetric trim in this hypothetical? The mean percentile of the distribution is 67%, which means that for every percent you trim from the bottom of the distribution, you only trim ½ of a percent from the top of the distribution. If you do that, you’ll see the resulting average for all the trims, including the median percent change, is 3%, not 2%. This is the proper, unbiased, estimate of the rate of inflation.
Let’s continue with Governor Waller’s discussion.
A second way of manipulating the data is to say in year 1, “Look, inflation is being driven by good A, which had an idiosyncratic, outsized price increase. If you throw it out, the underlying inflation rate is 2 percent.” Then in year 2, you say, “Good B had an idiosyncratic price increase, so throw it out.” Repeat for year 3. Again, by selectively throwing out unusually high price increases for individual goods, you would conclude that inflation over the three-year period is 2 percent and we are hitting the inflation target when, in fact, it was 3 percent.
This, I think, is an appropriate concern. Analysts look across the component price data and believe they can judge what should, and should not be considered idiosyncratic. But EVERY price change, in some sense, is special, responding to the characteristics and forces of their particular markets. The real risk is that an analyst who already has a notion of what the inflation rate is will find some justification for throwing out subsets of the data to fit the inflation rate they had pre-conceived.
I have my own story to tell in this regard (that I originally told at a 2014 Cleveland Fed conference “Torturing the CPI data until They Confess.”)
I remember a morning in 1991 at a meeting of the Federal Reserve Bank of Cleveland’s board of directors. I was welcomed to the lectern with, “Now it’s time to see what Mike is going to throw out of the CPI this month.” It was an uncomfortable moment for me that had a lasting influence. It was my motivation for constructing the Cleveland Fed’s median CPI. I am a reasonably skilled reader of a monthly CPI release. And since I approached each monthly report with a pretty clear idea of what the actual rate of inflation was, it was always easy for me to look across the items in the CPI market basket and identify any offending—or “distorted”—price change. Stripping these items from the price statistic revealed the truth—and confirmed that I was right all along about the actual rate of inflation.
The trimmed-mean inflation estimators, when properly constructed, don’t allow analyst bias to creep into the number. They’re entirely judgment free. Those who believe they can look across the components of the CPI and separate the anomalous data points from the inflationary data points are kidding themselves–whether they realize it or not. In other words, it’s best to just let the data speak for themselves.
Recent Posts
- Addressing Two Types of Bias in Inflation Estimation: A Lesson from Governor Waller’s Three-Good Economy
- Inflation Now vs. Inflation Then: Why the 12-Month Trend Leaves Us in the Dark
- Rupert Gets It
- Seeking Alpha Isn’t Impressed by the Trimmed-Mean PCE Measure — But Their Reasons Don’t Add Up.
- Chairman Warsh Announces Inflation Frameworks Task Force
- Asymmetric Median Inflation? Of Course! And Ball and Co-authors Made ‘Em.
- Are We Trimming Away Evidence of Future Inflation?
- Should a Central Bank “Target” Trimmed-Mean Estimators of Inflation?
Frequently Asked Questions
What is a “trimmed-mean estimator”?
What is the advantage of a trimmed-mean estimate of inflation?
What accounts for the fat-tails of price-change distributions?
Is the trimmed-mean estimator “core” inflation?
What is “asymmetric” trimming?
Why are some price change distributions asymmetric?
Should the trimmed-mean estimator be the target of a central bank?
Essential Data Resources
Median CPI — Cleveland Fed
The Cleveland Fed’s measure of the median component of monthly CPI inflation — a robust alternative to trimmed-mean approaches for filtering out extreme price changes.
Sticky Price CPI — Atlanta Fed
CPI components that change price infrequently, which tend to incorporate expectations more heavily and are closely watched by the Fed.
FRED — St. Louis Fed
The St. Louis Fed’s comprehensive economic data repository, with thousands of time series including all major inflation measures.
Underlying Inflation Dashboard — Atlanta Fed
An interactive dashboard tracking multiple measures of underlying inflation — trimmed mean, sticky price, and median CPI — to give a fuller picture of inflation trends.
Trimmed Mean PCE — Dallas Fed
The Dallas Fed’s trimmed mean PCE inflation rate, calculated by removing the most extreme price movements from the PCE index each month — one of the Fed’s preferred core inflation gauges.
Consumer Price Index–Bureau of Labor Statistics
Source data for the construction of the CPI and much of the PCE price Index.

About
This is a website about efficient inflation estmators and measures of core inflation. It draws heavily from the early work of Bryan and Cecchetti.

Michael F. Bryan
Michael F. Bryan is a former Vice President and Senior Economist at the Federal Reserve Bank of Atlanta, after earlier positions at the Federal Reserve Bank of Cleveland. He is one of the pioneers of trimmed-mean inflation measurement and co-originator of the methodology with Stephen Cecchetti. He has served on the faculty of Baldwin Wallace College, Cleveland State University, the University of Chicago, Emory University, and the University of South Carolina.
Email: mikefbryan@gmail.com

Stephen G. Cecchetti
Stephen G. Cecchetti is the Rosen Family Chair in International Finance at Brandeis University’s International Business School. He previously served as Economic Adviser and Head of the Monetary and Economic Department at the Bank for International Settlements (BIS), and as Director of Research at the Federal Reserve Bank of New York. He is widely recognized for his foundational work on trimmed-mean inflation estimators.
Email: steve.cecchetti@gmail.com